http://lib.westfield.ma.edu/censusaff.htm
A classed choropleth map is a thematic map where coloring or shading are used to
the measurement of a statistical variable(s) being displayed on a map. In this classed
choropleth map, shading is used based on median age.
Map Catalog Blog
Sunday, July 22, 2012
Lorenz Curve Graph Map
http://www.unc.edu/depts/econ/byrns_web/Economicae/Figures/Lorenz.htm
Here is an example of a Lorenz Curve graph, which is created by plotting the cumulative distribution of a variable against its' frequency. They are used a lot in economic studies to show distribution and inequality in wealth or income.
Bilateral Graph Map
http://www.theatlantic.com/international/archive/2010/10/china-and-international-rules-self-interested-or-malign/64747/
A bilateral graph shows two more data sets within the same graph. Here is an example of such which shows trade statistics between the U.S. and China.
A bilateral graph shows two more data sets within the same graph. Here is an example of such which shows trade statistics between the U.S. and China.
Population Profile Map
http://www.ifad.org/operations/regional/pf/aids_1.htm
A population profile shows the number of individuals within an area (population) as a function of their ages. Here is an example of such, showing the projected number of individuals with and without AIDS in Botswana, Africa by 2020.
A population profile shows the number of individuals within an area (population) as a function of their ages. Here is an example of such, showing the projected number of individuals with and without AIDS in Botswana, Africa by 2020.
Scatterplot Map
http://www.stat.yale.edu/Courses/1997-98/101/scatter.htm
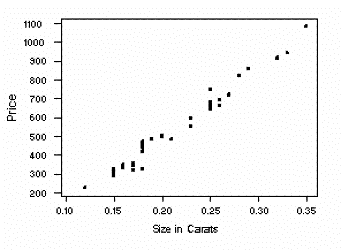
A scatterplot is graphical representation which uses the Cartesian coordinate system to show two sets of variables. Here is an example of such showing the size of diamonds in carats and their price.
A scatterplot is graphical representation which uses the Cartesian coordinate system to show two sets of variables. Here is an example of such showing the size of diamonds in carats and their price.
Index Value Plot Map
http://envstudies.brown.edu/oldsite/Web/special%20reports/Classes/ES201/2000/Drought%20Management/D%20-%20Indicators/indices%20with%20data/PDI/index%20value%20graph.html
An index value plot is a type of visualization map where an index value (not absolute value) is plotted on a line graph. This is used a lot within the stock market, to show the drop or rise of a stock or investment.
An index value plot is a type of visualization map where an index value (not absolute value) is plotted on a line graph. This is used a lot within the stock market, to show the drop or rise of a stock or investment.
Correlation Matrix Map
http://www.psychstat.missouristate.edu/multibook/mlt06m.html
A correlation matrix is a way to show the relationship(s) between data sets. Here is an example of such, which shows the success of students in graduate school based on multiple data and variables (intellectual ability, work ethic etc).
A correlation matrix is a way to show the relationship(s) between data sets. Here is an example of such, which shows the success of students in graduate school based on multiple data and variables (intellectual ability, work ethic etc).
Subscribe to:
Comments (Atom)


