http://www.physics.csbsju.edu/stats/box2.html
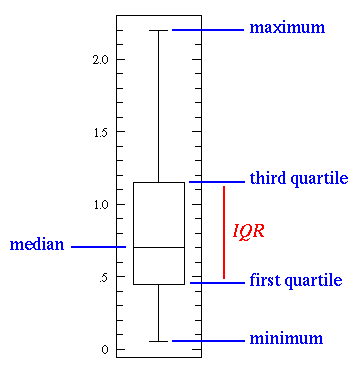
Here is an example of a box plot which is a way to show numerical or statistical information in agraphical manner, through the use of five number summaries: sample minimum, lower quartile, median, upper quartile and sample maximum. It may also include any outliers, if any.

No comments:
Post a Comment