http://personalpages.manchester.ac.uk/staff/m.dodge/cybergeography/atlas/census.html
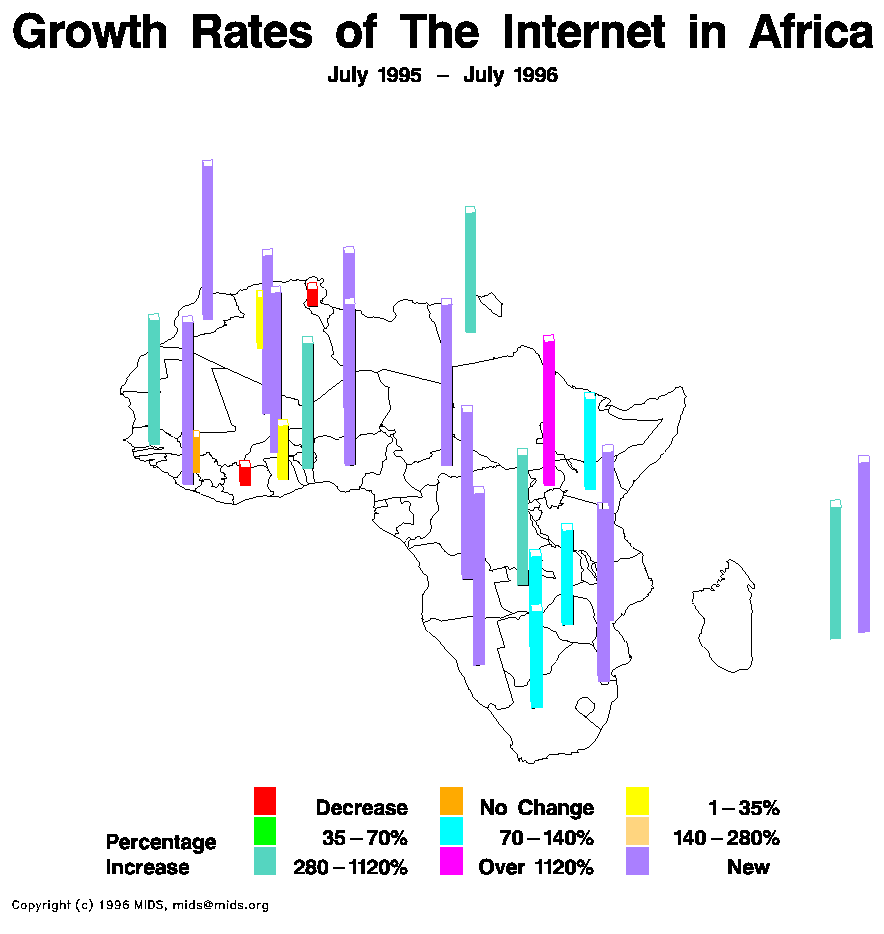
A statistical map shows variation in specific factor(s) for a given an area. Here is an example of such, showing the growth rates of internet use in Africa between 1995 and 1996.

No comments:
Post a Comment